Have you ever stood in front of a map and glanced down at the words ‘Mercator map projection’ or Lambert Conformal Conic projection’? Have you seen an unusually shaped representation of the Earth in a book and wondered why this might be? Or perhaps you recall from a geography class at school that there are different map projections, perhaps vaguely aware that there is more than one way of representing the Earth.
Because the Earth is not flat but spheroid in shape, a translation process must take place in order to portray the curved surface of the earth on a flat surface such as a printed map of the world or a computer screen. So essentially a map projection is an arithmetic formula developed to deal with the problem of how to get the Earth onto a flat surface.
Technically speaking the geographic points on the curved surface require transformation into a set of Cartesian coordinates which can represent positions on the 2D surface. Because it is impossible to visualise the true geographic coordinates on a flat surface, a set of equations is developed to handle the necessary distortions needed in the data to achieve a flat plane map. In truth, the area of map projections is highly complex and the enthusiast can easily lose themselves in many hours of reading; to give one example of this complexity the map projection ‘conformal conic projection with two standard parallels’ means that the projection is conformal, that the intermediate surface is a cone, and that the cone intersects the ellipsoid (or sphere) along two parallels…
Map projections are often named after the mathematician or inventor responsible for arithmetic formula. Today, it is usually the job of the cartographer or editor to choose a suitable map projection, taking into account the purpose of the map.
Mercator Projection
For example in choosing the Mercator projection, a popular conformal distortion, Greenland appears much larger than it really is because areas are exaggerated towards the poles. This map projection has properties that suite navigational uses.

Despite being only one-eighth the size of South America, Greenland appears much larger than it really is with the Mercator projection as areas are greatly exaggerated towards the poles.
Peter’s Projection
Conversely with a cylindrical equal area projection such as Peter’s, land areas are shown as true relative areas, however the shapes on the map are distorted. Such equal area projections are recommended for maps displaying geographic distributions such as population or deforestation, so that phenomena per unit area are shown in correct proportion.
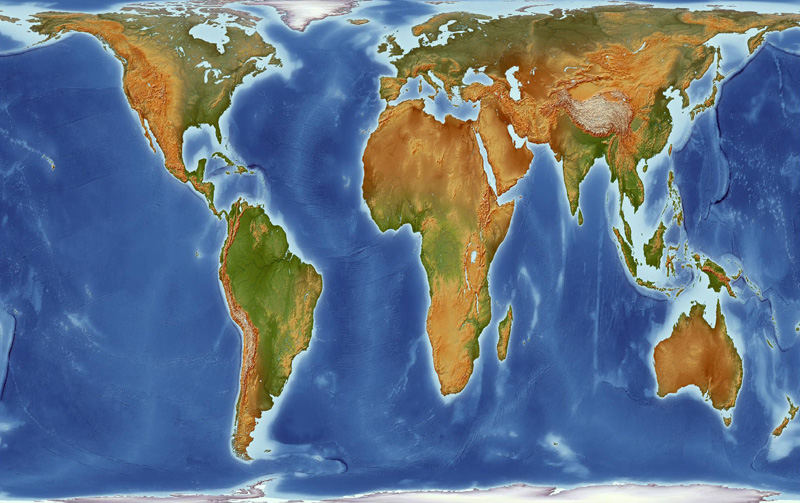
Peter’s projection displays the Continents at their true relative areas but shapes are distorted
Robinson Projection
The Robinson projection is a good example of a map projection that balances area and shape distortion and is seen as a good compromise, being adopted by the National Geographic Society for general purpose word maps.
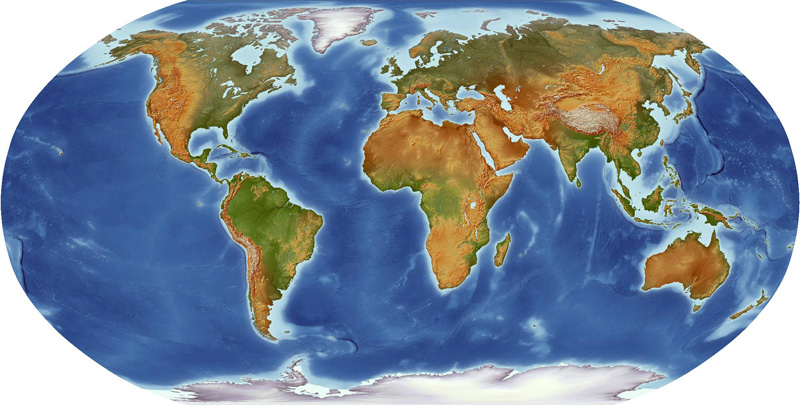
The Robinson projection balances area and shape distortion.
Hopefully the next time you look at a wallmap, you will have a better idea of why map projections exist in the first place and perhaps even recognize the name of the inventor or mathematician responsible. We’ve also signposted you towards further reading if you have some time on your hands and an inquisitive mind! Choosing the right map projection is actually a crucial decision and should be made with the subject matter and audience in mind.
Further reading: The Mercator Projection – How interactive maps can wrongly influence our perception of the world
Comments are closed here.