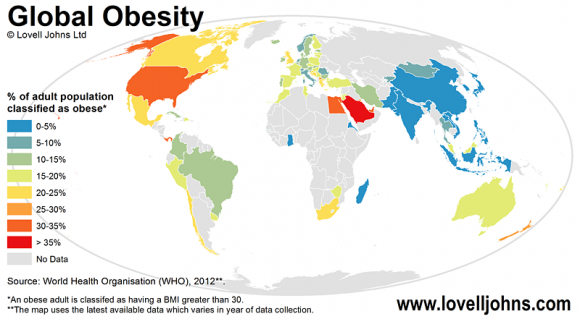
Following our Obesity in Europe Map and after recent reports describing how obesity is a threat to world food security we have now created a world obesity map which highlights which countries are effected by the problem.
The “World Obesity” map has been created from statistics collated by the World Health Organisation (WHO). Each country has been shaded depending on the percentage its adult population classified as obese. An obese adult is classified as having a Body Mass Index (BMI) greater than 30. The map uses a Mollweide projection which accurately depicts area proportion, making it a suitable choice for depicting Global statistics.


Comments are closed here.